Redesigning the Polestar 2 dashboard

Spring 2023

A man with short hair and a slight smile sitting in the driver's seat of a convertible car, holding the steering wheel with both hands, with a blurred background indicating motion.

“One day car makers will learn that a big screen that’s fiddly to use while you’re managing 500 horsepower on a snowy road makes a car feel cheaper and stupid, not more expensive and clever but sadly that day is not today”

(Top Gear BMW M3 touring)

-Ollie Kew,

Top Gear Senior Road Test Editor

  • A digital display with the text titled 'Introduction.' The display shows a map with a blue route, a search bar, and location markers labeled 'Orange Point' and 'Destination.' There are app icons and controls at the bottom of the screen.

  • A digital infographic comparing car performance through a swedish automotive magazine test, featuring text, statistics, and a list of cars with their times to complete four tasks.

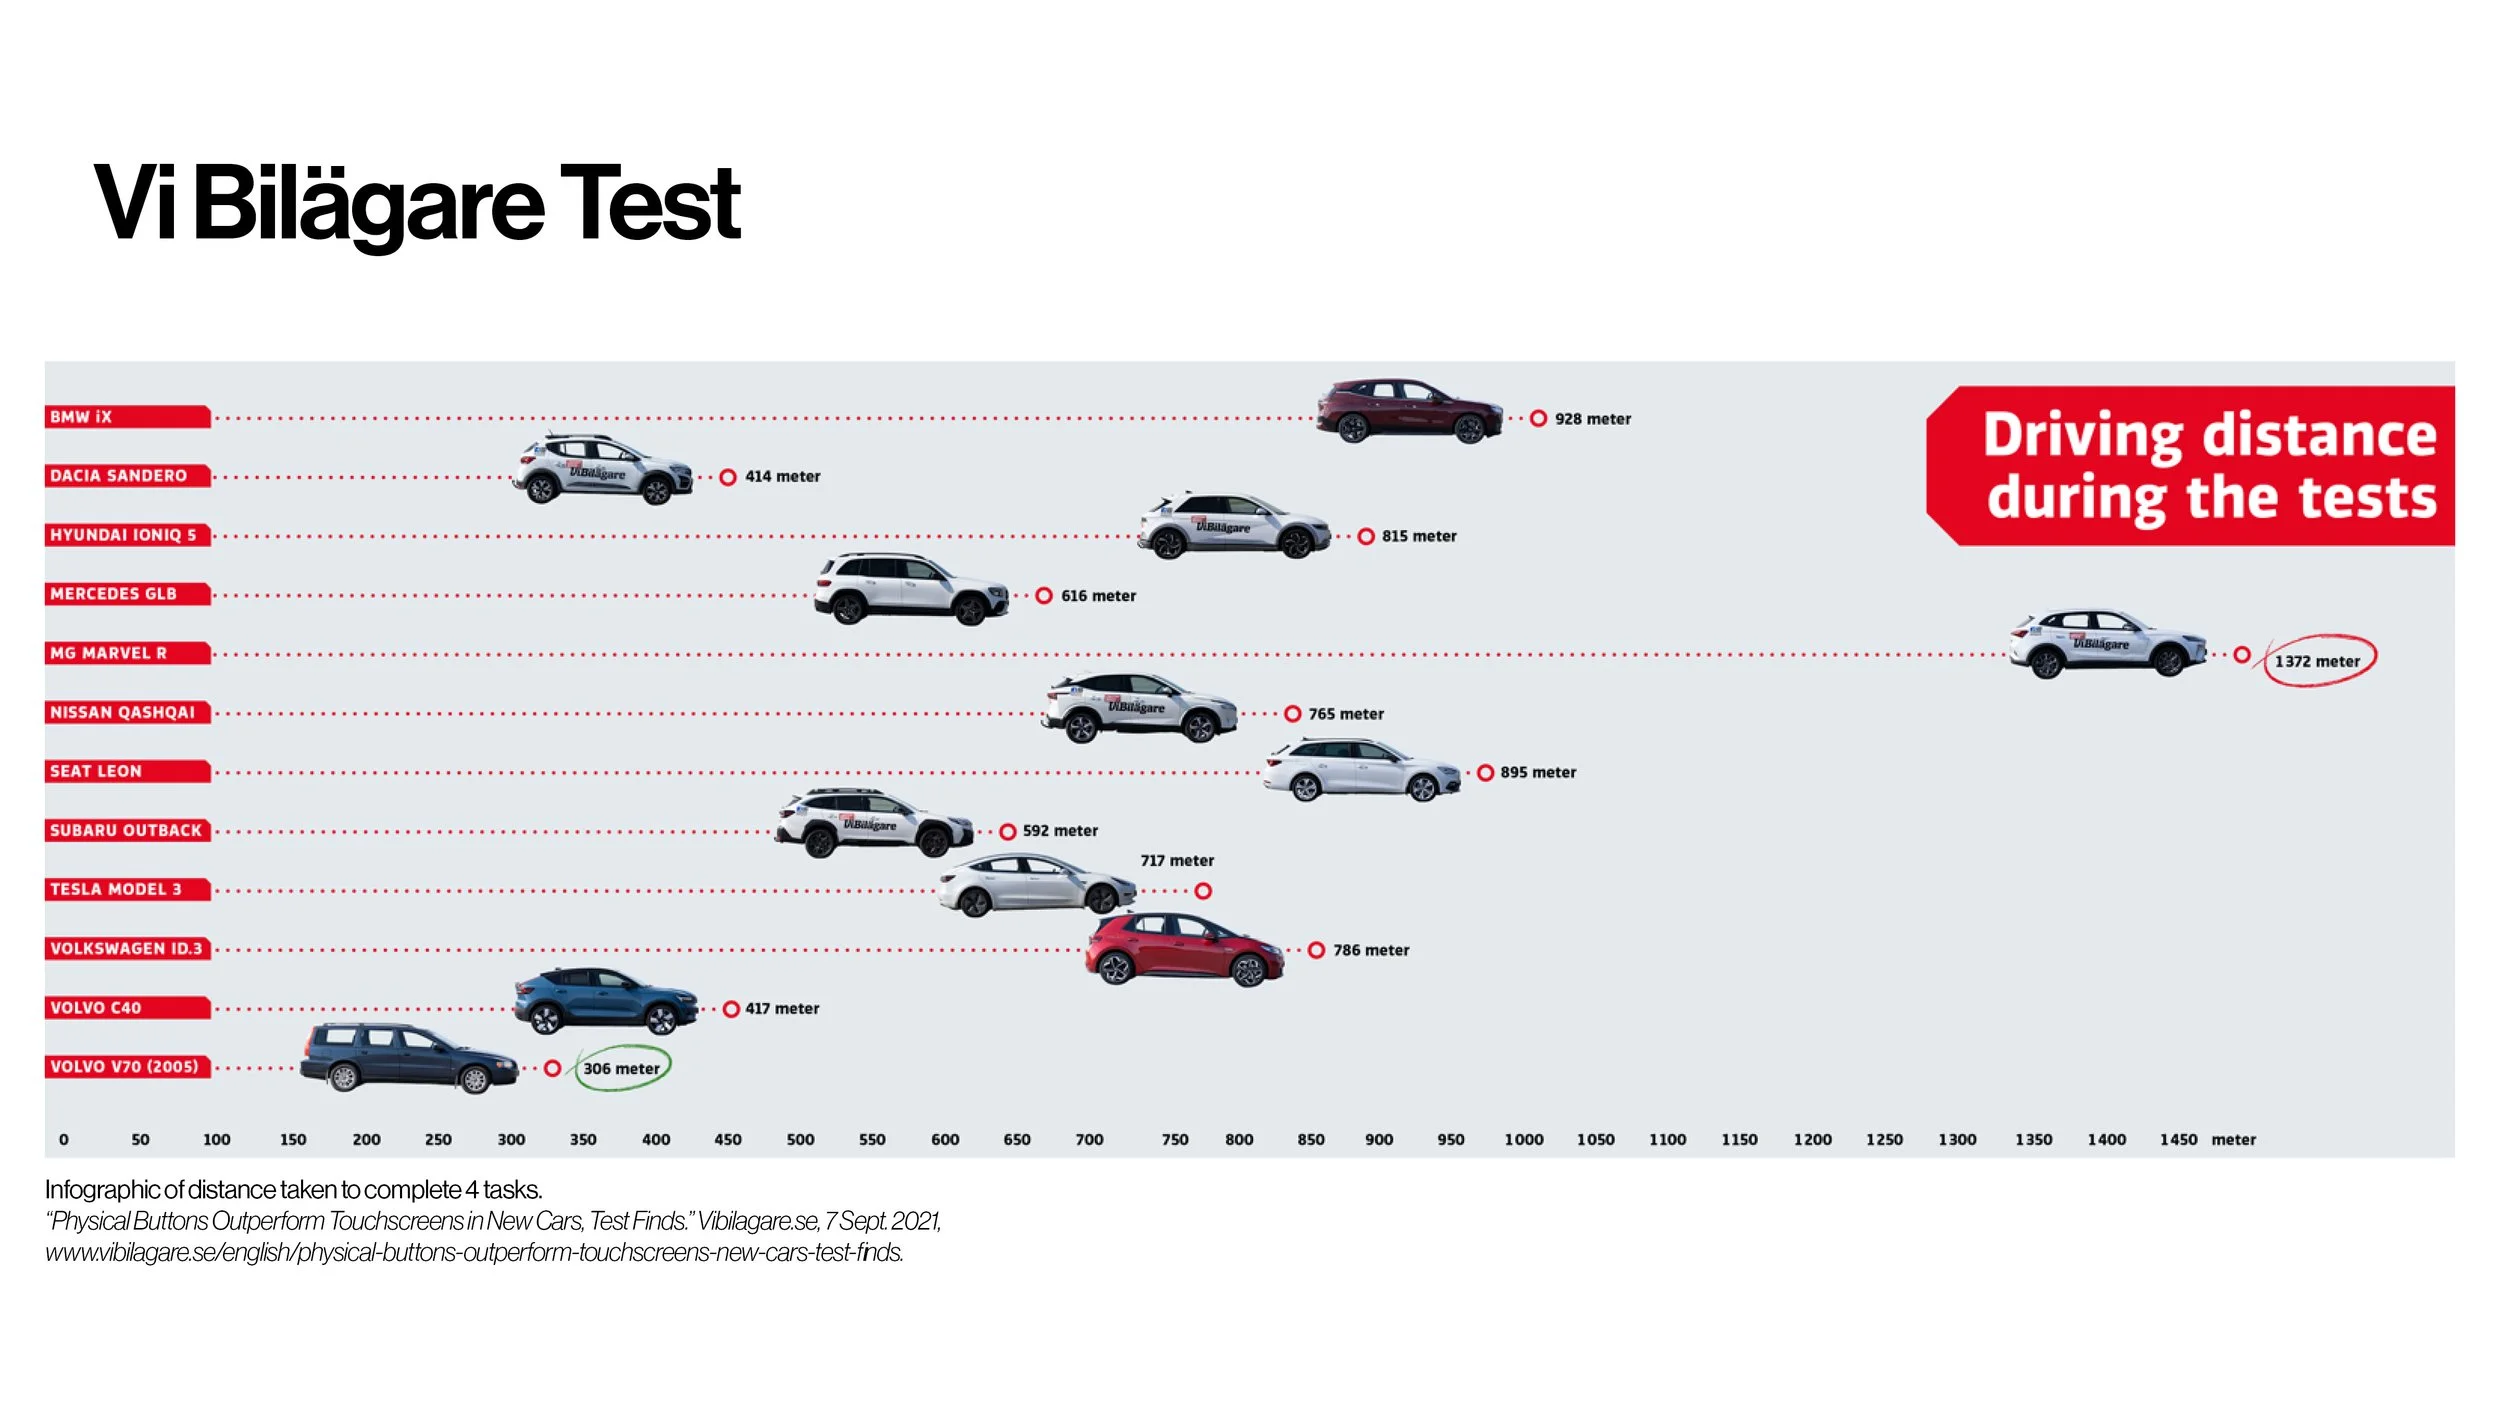
  • Infographic showing driving distances for different cars during tests, with cars positioned along a horizontal scale representing meters. The distances range from 306 meters for a Volvo V70 (2005) to 1372 meters for a BMW iX, with each vehicle's name on the left and their respective distances on the right.

  • Partial view of a silver car with significant front-end damage from a collision on the right side of the image.

Analysis

All problems require research and understanding.
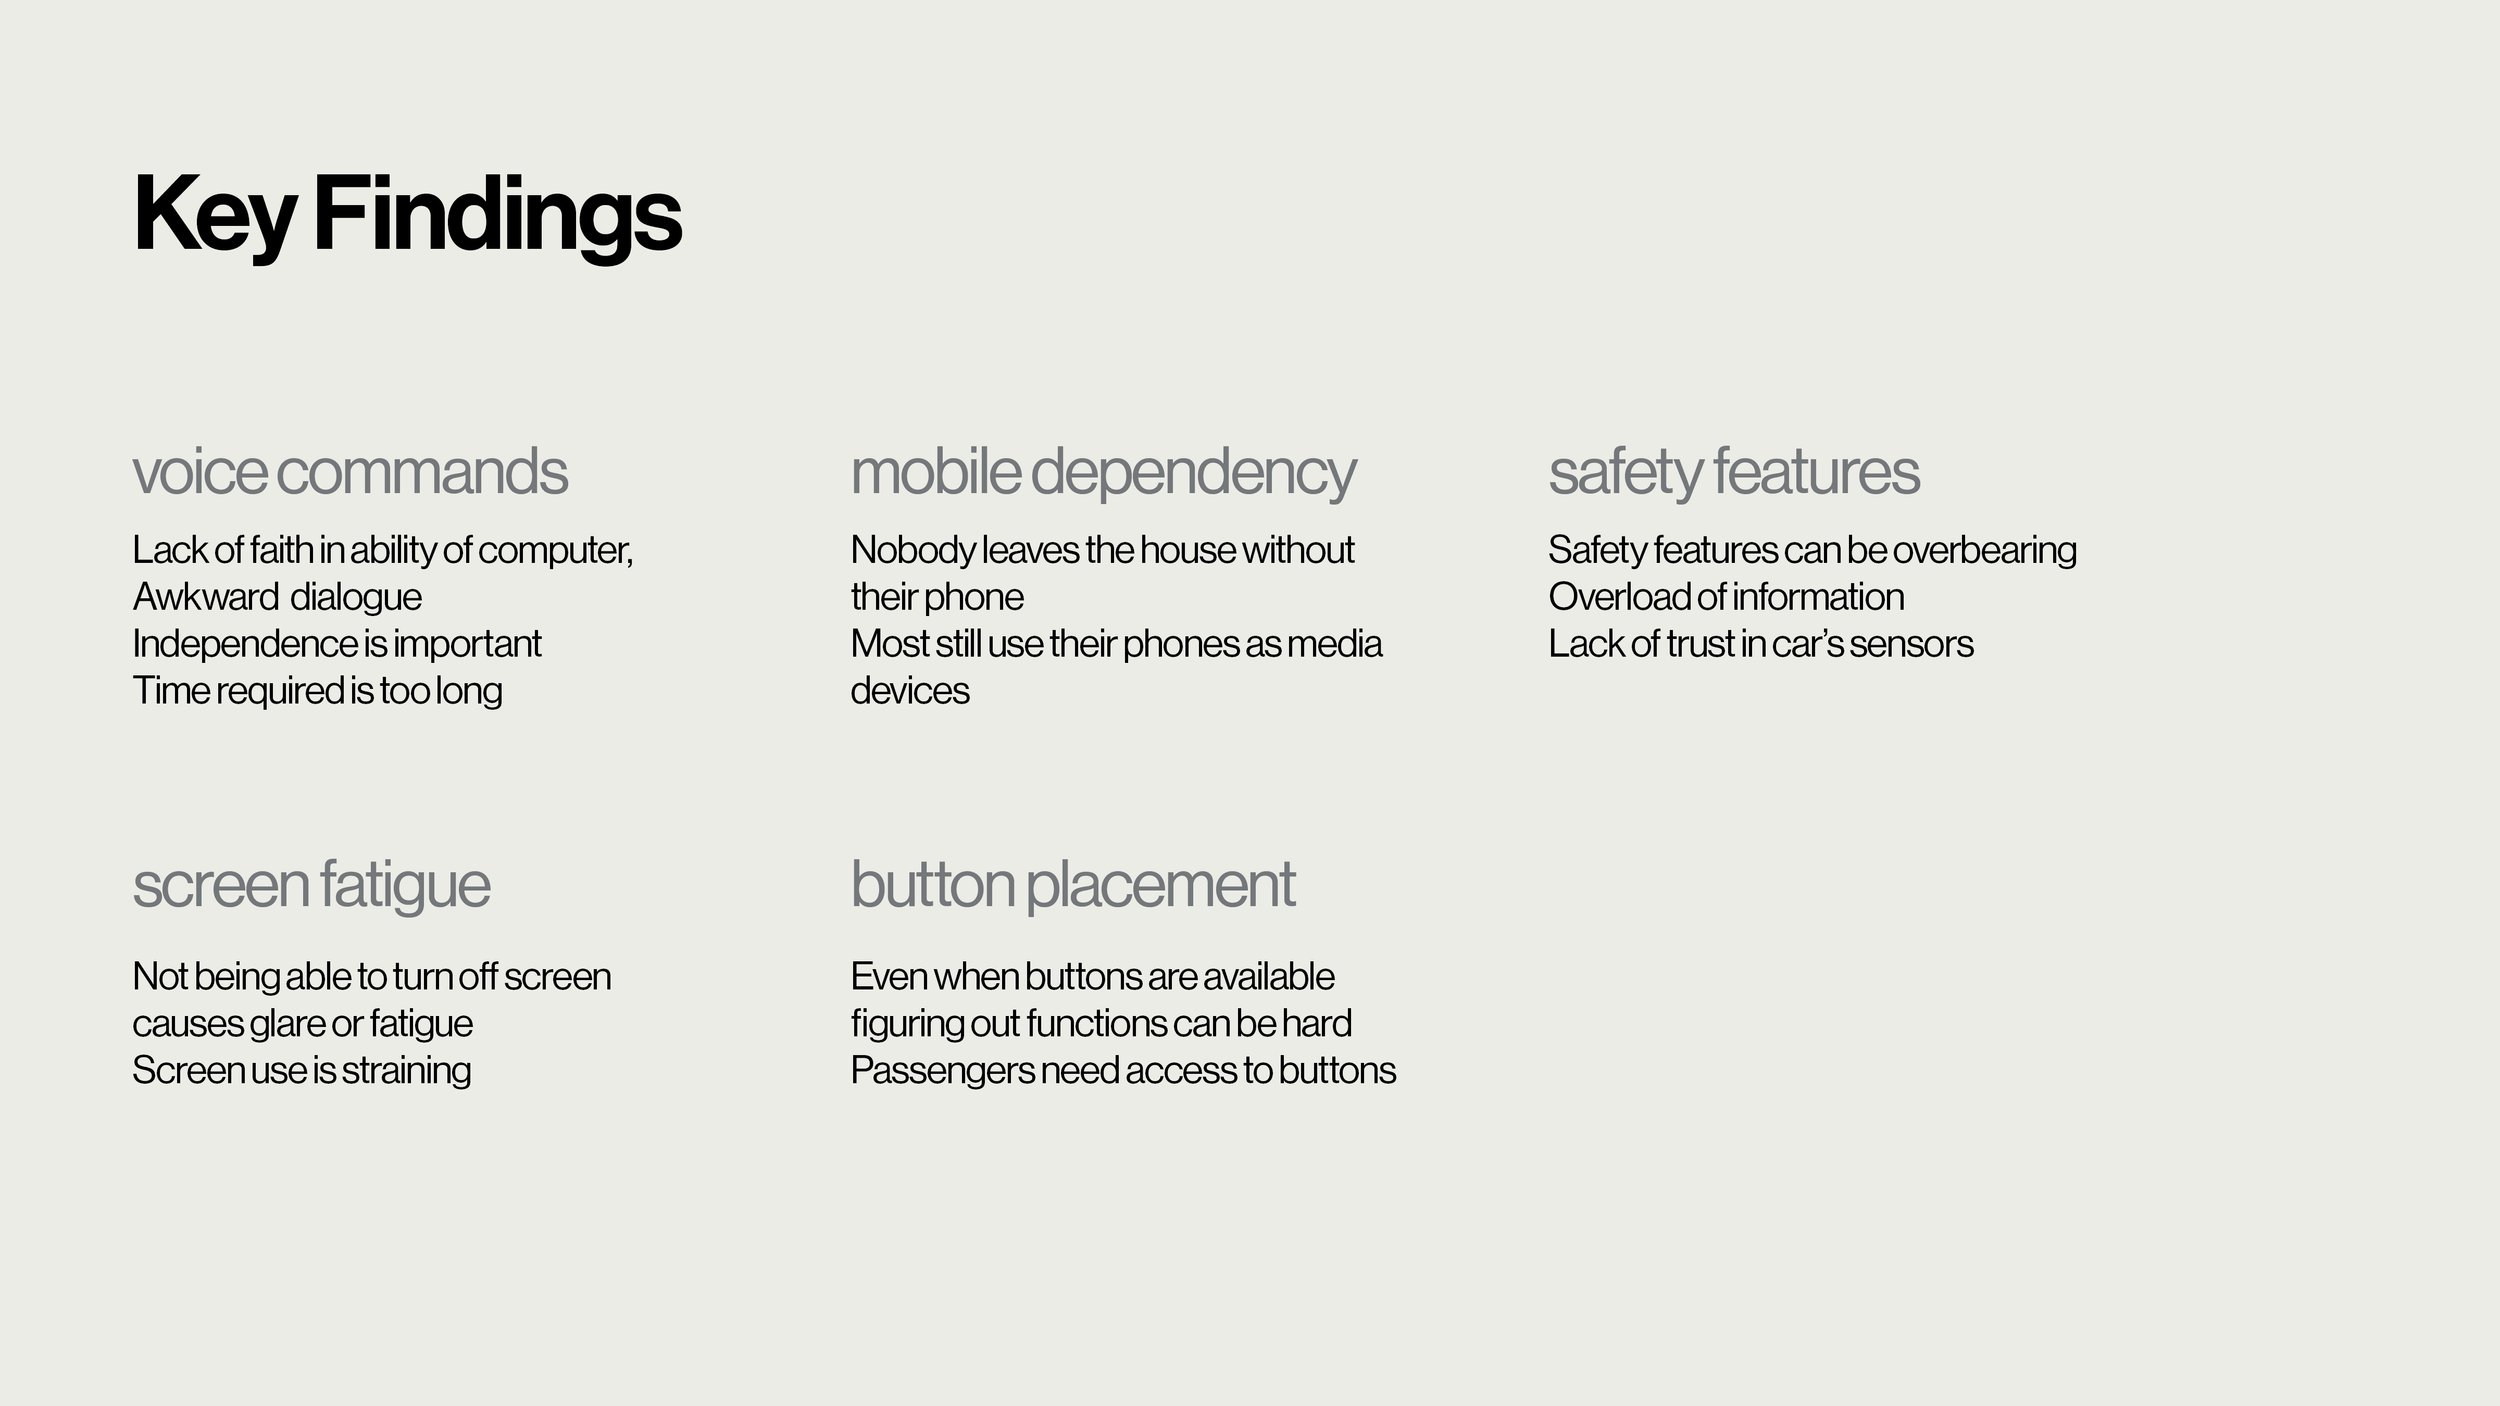
A report page titled 'Key Findings' with sections on voice commands, mobile dependency, safety features, screen fatigue, and button placement, each listing related issues and observations.
A graphic titled 'User Journey' outlining the typical flow of an average car journey in stages: Pre-Journey, Entrance/Setup, Drive, Mid Journey, Parking, Locking up, with descriptions for each stage.
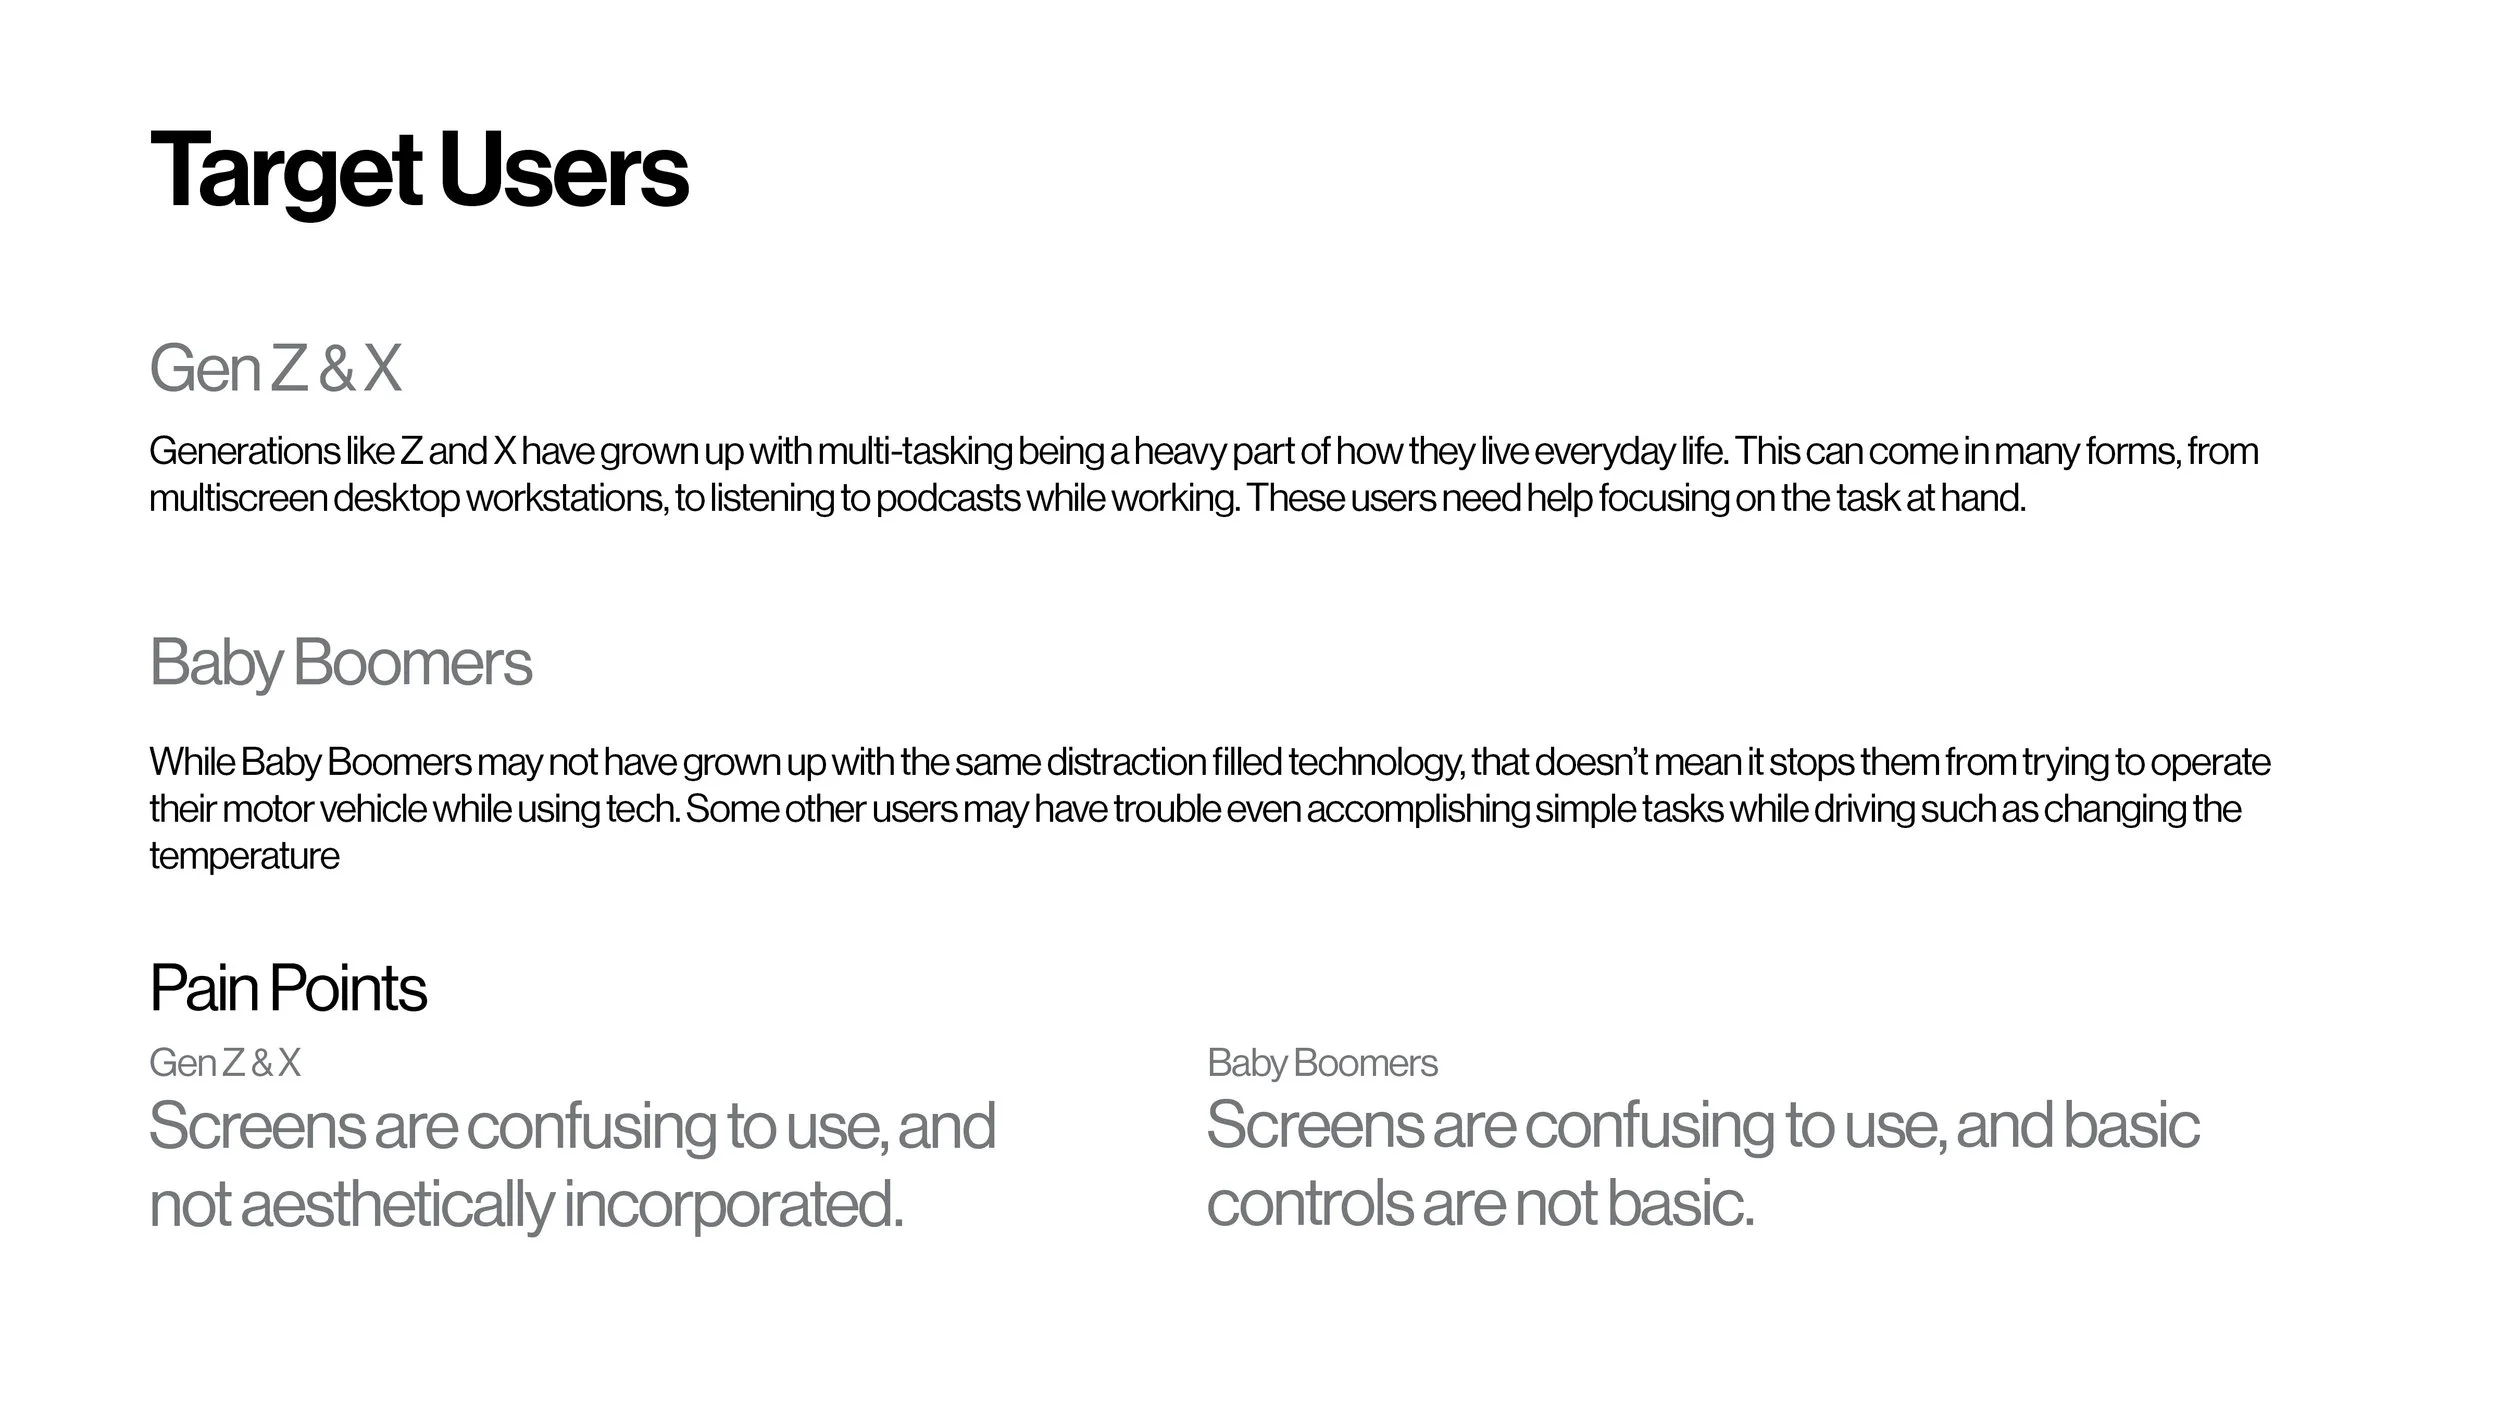
A presentation slide with black and gray text on a white background, discussing target users including Gen Z, X, and Baby Boomers, their habits with technology, and common pain points.
Image showing a webpage with the title 'Research Methods'. The page discusses user interviews, observation, and test drives, with black and white photos of people in various settings below the text.
Black and white photograph of a middle-aged man in a suit and tie, smiling slightly, with a professional background featuring large windows.

“If you think good design is expensive, you should look at the cost of bad design.”

— Ralf Speth

Digital vehicle dashboard display showing a speed of 3 km/h, a fuel gauge, and an odometer reading of 112.
Text explaining heads-up display (HUD) technology used in cars, showcasing its functions for navigation and information projection on the windshield.
Close-up of a digital thermostat display showing 15 degrees and a second display showing 30 degrees. The thermostat is placed on a textured gray surface near a white keyboard.
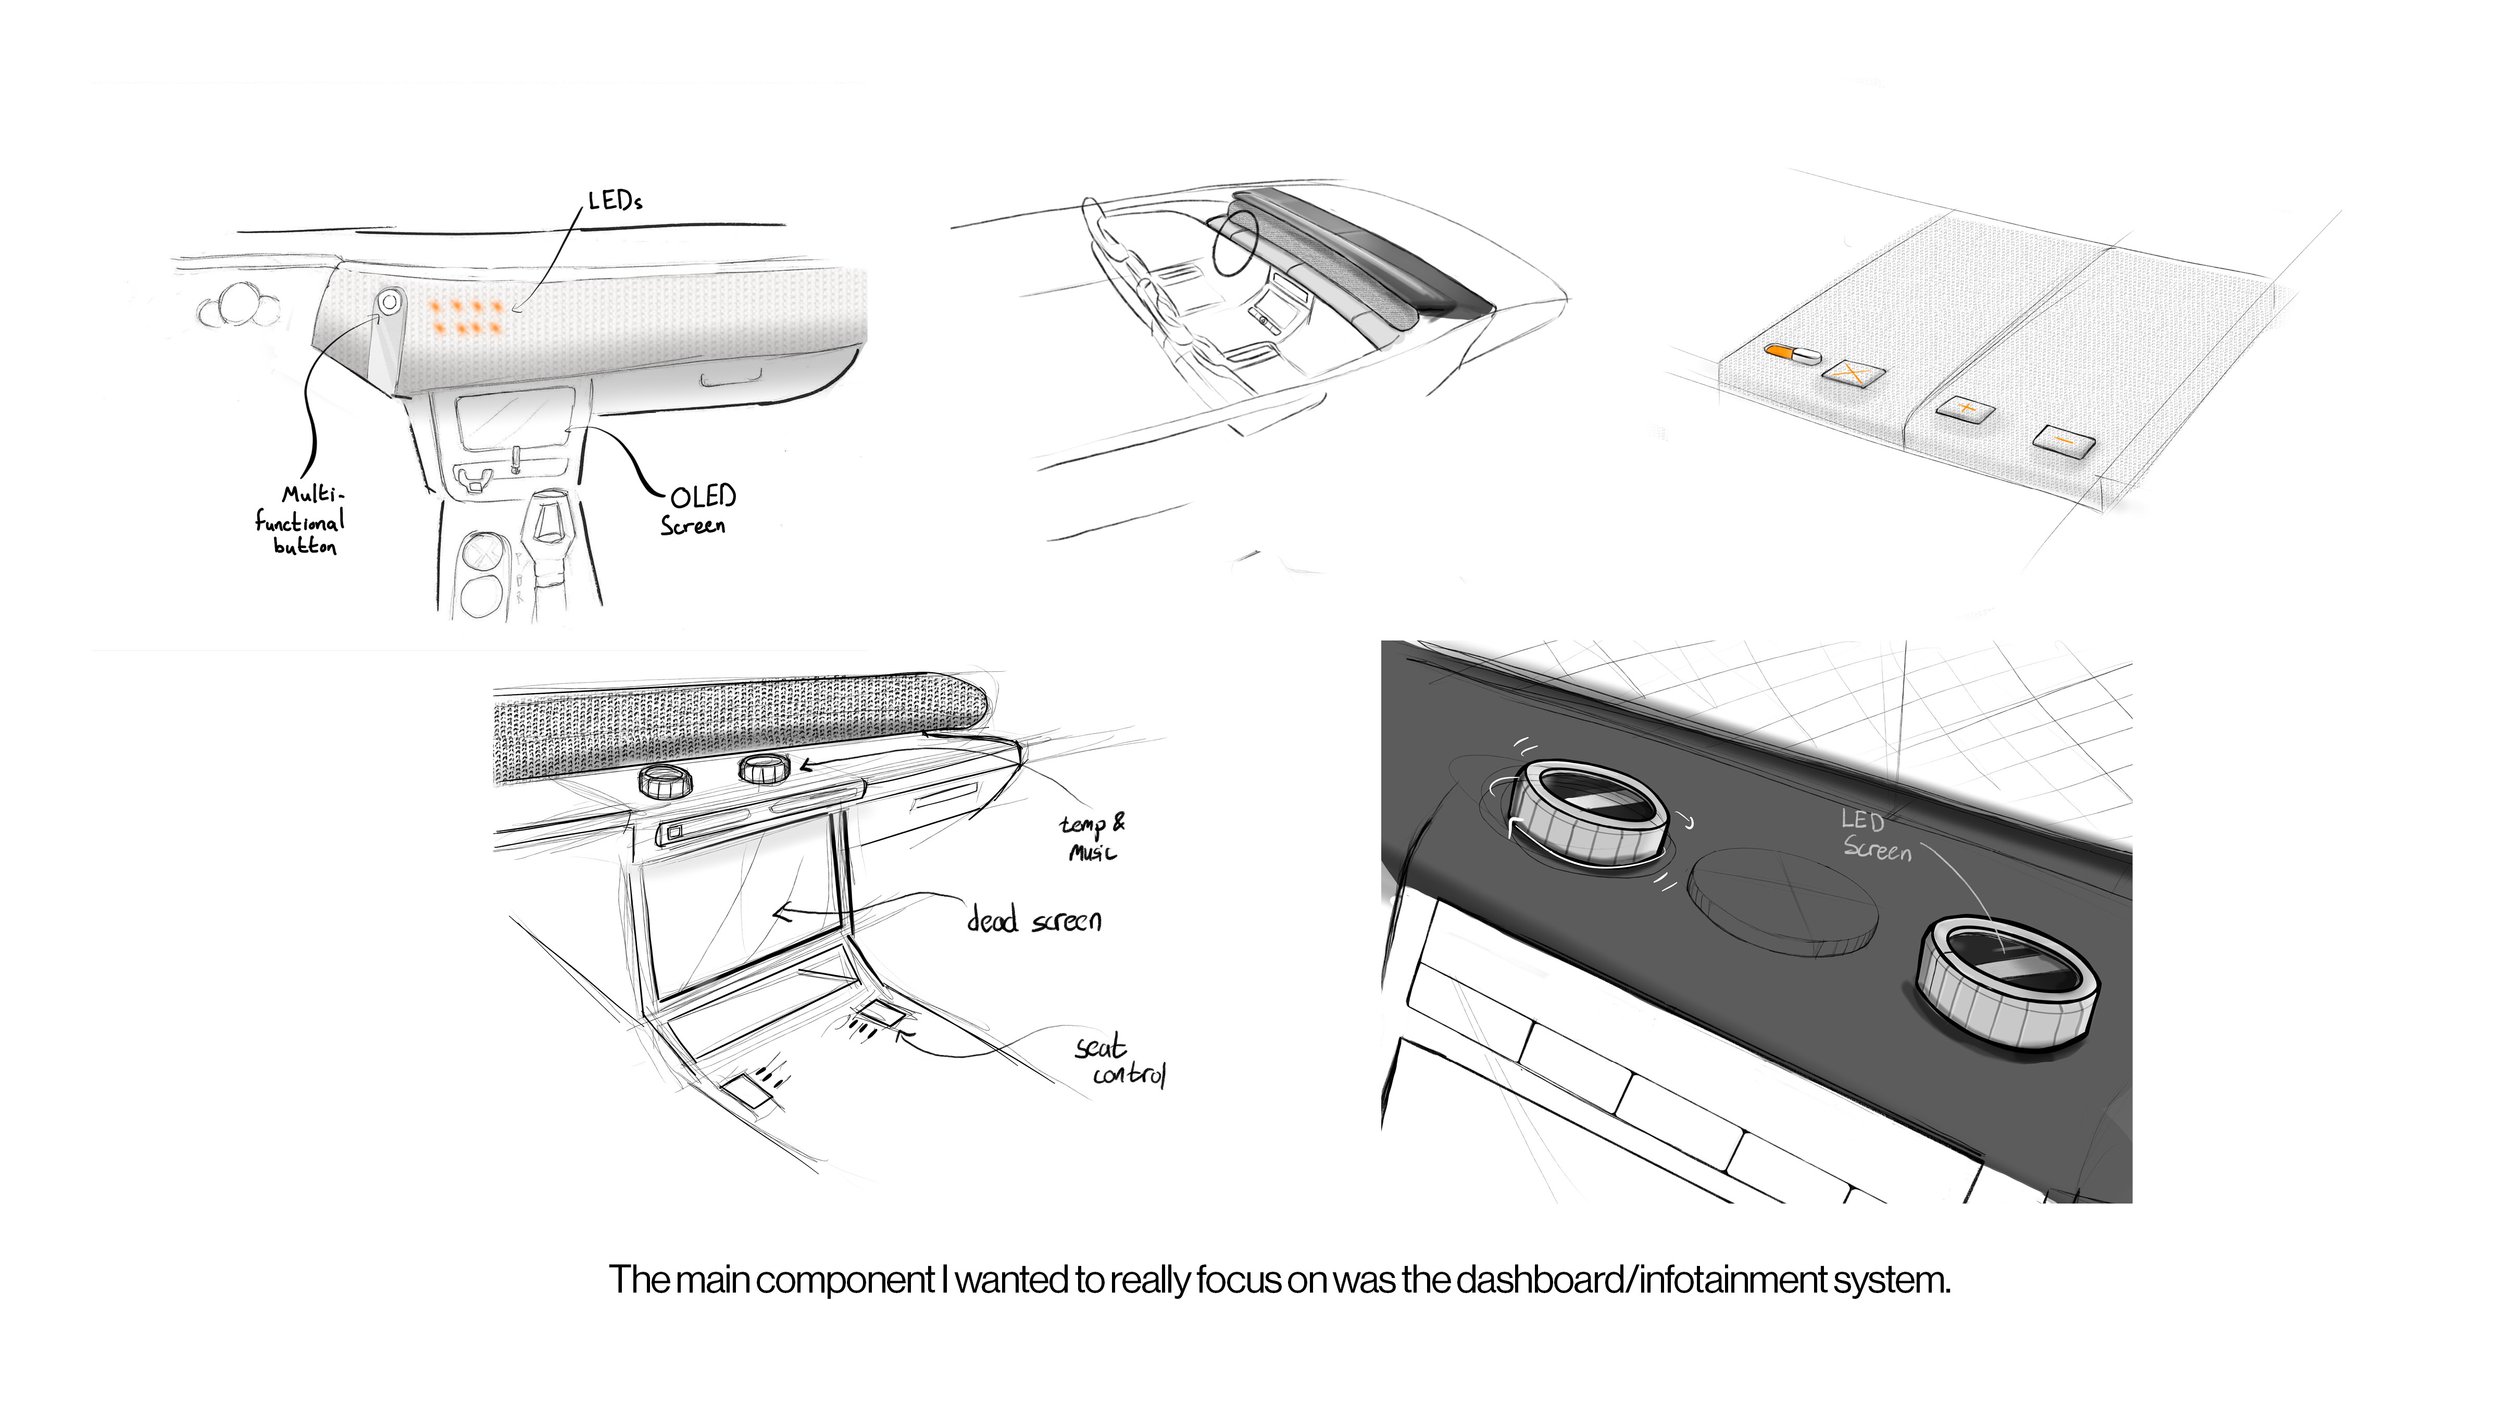
Text explaining the functions of hard and hybrid car buttons, including climate control, music, temperature, LED screens, and mobility features.
Inside view of a futuristic car dashboard with a digital steering wheel, a large widescreen display showing navigation and media controls, and climate control knobs.
Text discussing display technology and features, including primary and secondary displays, their functions, and design considerations.